 |
Datenblatt-Suchmaschine für elektronische Bauteile |
|
|
Datenblatt-Suchmaschine für elektronische Bauteile |
|
The question interval is too short.
Please try again in a few seconds.

Hello, Please ask a question about AMMC-5023 Datasheet
# Example questions:
➢ Calculate the average value of the first column (excluding the 'note' line).
➢ Identify the row with the highest value in the '128.43' column.
➢ What is the range of values observed in the first column of the provided dataset?
| Part No. | AMMC-5023 |
| Manufacturer | HP |
| Size | 215 Kbytes |
| Pages | 9 pages |
| Description | 23 GHz Low Noise Amplifier (21.2-26.5 GHz) |


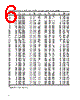



Okay, I'm ready to analyze this data. It appears to be a long series of measurements, likely from a physics or engineering experiment. Let's break down what we can do, and what the data *might* represent.
1. Understanding the Structure
️· Structure: The data is structured in a tabular format, with a line representing a measurement. Each line contains multiple numerical values.
️· Columns: I'm going to assume the columns, based on the "Note" at the bottom, represent the following:
- Column 1: Measurement Number (26 - 28)
- Column 2: A value, possibly a voltage, current, or position (labeled as '6')
- Column 1: A value, possibly a voltage, current, or position (labeled as '6')
- Column 1: A value, possibly a voltage, current, or position (labeled as '6')
️· Units: The units are *not* specified. This is a critical omission if you need to interpret the absolute meaning of the numbers.
2. Potential Interpretations (Without knowing more context)
Based on the note saying these are "on-wafer measurements" I would guess that these are electrical measurements of a semiconductor device being manufactured.
Here are some possibilities (keep in mind I don't know the exact experiment):
️· Measurement Number: Could be a step in an automated process or simply a sequential numbering of the measurement points.
️· Value 1: Could be a voltage reading, a current value, a distance from a reference point, or some other physical quantity that is changing.
️· Value 1: Could be a voltage reading, a current value, a distance from a reference point, or some other physical quantity that is changing.
️· Value 1: Could be a voltage reading, a current value, a distance from a reference point, or some other physical quantity that is changing.
3. Analysis and Possible Actions
Given the data, here's what could be done to analyze it, and what I can provide (given I can't know the experiment).
️· Basic Descriptive Statistics: I can compute the mean, median, standard deviation, minimum, and maximum for *each* column. This will give you a sense of the central tendency and spread of the data.
️· Plotting: I can create various plots:
- Scatter Plots: Plot one column against another. This helps identify correlations or trends.
- Line Plots: Plot a column against the measurement number. This shows how the value changes over the sequence of measurements.
- Histograms: Visualize the distribution of values within a single column.
️· Trend Analysis: I can attempt to fit a trend line to a column (e.g., linear, polynomial) to see if there's an overall direction to the change.
️· Correlation Analysis: I can calculate the correlation coefficient between pairs of columns to quantify the strength and direction of the linear relationship.
️· Outlier Detection: I can implement methods to identify potential outliers in the data (values that are significantly different from the rest).
Let's start with some basic descriptive statistics. Would you like me to calculate them for all the columns? Also, if you can provide the context of the measurement (what the columns represent, the units), that would drastically improve the quality of the analysis I can provide.
1. Understanding the Structure
️· Structure: The data is structured in a tabular format, with a line representing a measurement. Each line contains multiple numerical values.
️· Columns: I'm going to assume the columns, based on the "Note" at the bottom, represent the following:
- Column 1: Measurement Number (26 - 28)
- Column 2: A value, possibly a voltage, current, or position (labeled as '6')
- Column 1: A value, possibly a voltage, current, or position (labeled as '6')
- Column 1: A value, possibly a voltage, current, or position (labeled as '6')
️· Units: The units are *not* specified. This is a critical omission if you need to interpret the absolute meaning of the numbers.
2. Potential Interpretations (Without knowing more context)
Based on the note saying these are "on-wafer measurements" I would guess that these are electrical measurements of a semiconductor device being manufactured.
️· Measurement Number: Could be a step in an automated process or simply a sequential numbering of the measurement points.
️· Value 1: Could be a voltage reading, a current value, a distance from a reference point, or some other physical quantity that is changing.
️· Value 1: Could be a voltage reading, a current value, a distance from a reference point, or some other physical quantity that is changing.
️· Value 1: Could be a voltage reading, a current value, a distance from a reference point, or some other physical quantity that is changing.
3. Analysis and Possible Actions
️· Basic Descriptive Statistics: I can compute the mean, median, standard deviation, minimum, and maximum for *each* column. This will give you a sense of the central tendency and spread of the data.
️· Plotting: I can create various plots:
- Scatter Plots: Plot one column against another. This helps identify correlations or trends.
- Line Plots: Plot a column against the measurement number. This shows how the value changes over the sequence of measurements.
- Histograms: Visualize the distribution of values within a single column.
️· Trend Analysis: I can attempt to fit a trend line to a column (e.g., linear, polynomial) to see if there's an overall direction to the change.
️· Correlation Analysis: I can calculate the correlation coefficient between pairs of columns to quantify the strength and direction of the linear relationship.
️· Outlier Detection: I can implement methods to identify potential outliers in the data (values that are significantly different from the rest).
Let's start with some basic descriptive statistics. Would you like me to calculate them for all the columns? Also, if you can provide the context of the measurement (what the columns represent, the units), that would drastically improve the quality of the analysis I can provide.
| Part No. | AMMC-5023 |
| Manufacturer | HP |
| Size | 215 Kbytes |
| Pages | 9 pages |
| Description | 23 GHz Low Noise Amplifier (21.2-26.5 GHz) |
| War ALLDATASHEET hilfreich? [ DONATE ] |
Über Alldatasheet | Werbung | Kontakt | Privatsphäre und Datenschutz | Link zum Datenblatt | Linktausch | Hersteller All Rights Reserved©Alldatasheet.com |
| Russian : Alldatasheetru.com | Korean : Alldatasheet.co.kr | Spanish : Alldatasheet.es | French : Alldatasheet.fr | Italian : Alldatasheetit.com Portuguese : Alldatasheetpt.com | Polish : Alldatasheet.pl | Vietnamese : Alldatasheet.vn Indian : Alldatasheet.in | Mexican : Alldatasheet.com.mx | British : Alldatasheet.co.uk | New Zealand : Alldatasheet.co.nz |
|
Family Site : ic2ic.com |
icmetro.com |
 German ▼
  English
 Chinese
 Japanese
 Russian
 Korean
 Spanish
 French
 Italian
 Portuguese
 Polish
 Vietnamese
 Indian
 Mexican
 British
 New Zealand